Léonard Noth
ENFRDE
← projects

KOCO Predict

Forecasting a bin so trucks stop driving to empty ones

Forecasting how fast a waste container fills, so collection trucks stop driving to bins that aren't full.

Role
Research engineer
Scope
Data pipeline · Model selection · Evaluation design · Delivery tooling
Built with
Python, Darts, Prophet, PyTorch, Docker, pandas
Team
iSIS institute mandate for KOCO Solutions AG, supervised by Dr Sandy Ingram; earlier groundwork by two colleagues
Timeline
Innosuisse innovation cheque 71039.1 INNO-ICT · my work May 2024 – May 2025
Outcome
Prophet cut mean absolute error from the incumbent's 75.0 kg to 48.04 kg on real collection days, and MAPE from 40.4% to 19.8%. Both partners rated the project 1 of 4 (very successful) in the final report to Innosuisse.

The problem

KOCO's existing forecast was an adaptive linear regression: average the fill rate between two collections and extrapolate. It works, but it only ever sees data from collection days, a handful of points a week. The company wanted to know whether eighteen months of sparse weighings could support something better.

My role

Research engineer. Earlier work existed when I arrived; I redid most of it, designed the evaluation, and carried the results in front of the client.

Read as
The essentials in two minutes

Impact

48.0 kg vs. 75.0 kg
Prophet vs. incumbent MAE
19.8% vs. 40.4%
Mean absolute percentage error
6, evaluated two ways
Model families compared
25.6% vs. 2.15%
Real points, daily vs. hourly
71039.1 INNO-ICT
Innosuisse project

The system design

  1. One container at a time

    Filter the export down to a single chip, collection point and waste type. The models are per-container, not global.

    • 27,722 raw weighings across 372 container series and 118 collection points
  2. Sparse weighings into a continuous rate

    Each collection becomes a linear segment: divide the weight gained by the days elapsed, and interpolate between measurements to get a kg/day series.

    • A synthetic zero row after each measurement marks the emptying
    • At hourly resolution only 2.15% of the resulting points were real measurements; at daily, 25.6%
  3. Log, split, fit

    Take the log of the target so one enormous weighing can't dominate, hold back the last stretch as a test set, and fit each model family.

    • Outliers were damaging the fit; a log keeps every observation instead of deleting real collection events
  4. Score it twice

    Compare every model against the incumbent on all interpolated points, and again on real collection days only.

    • The first measures whether the curve is right; the second measures whether it's useful on the day a dispatcher decides
    • The two rankings did not agree, and that disagreement was the finding
  5. Hand over something runnable

    A dockerised train-and-infer pipeline driven by a config file, plus a separate analysis toolkit.

    • Changing the target container is a three-line config edit
    • Seven parameterised analyses, each writing a spreadsheet and a set of plots
Platform services
  • Darts + Prophet

    One fit/predict surface across statistical and neural models, so the comparison is like for like

  • pandas + openpyxl

    Reads the Excel export the client actually sends, unchanged

  • PyTorch Lightning

    Backed the RNN, LSTM and Transformer experiments that ultimately lost

  • TOML configuration

    Every knob lives in config rather than code, so retraining doesn't need a developer

  • Docker Compose

    Training and inference as independently switchable services

  • Jupyter toolkit

    A second deliverable: seasonality, measurement intervals and trends per waste type, filterable

Five model families against the incumbent

Collection days only, the number a dispatcher actually acts on. Mean absolute error and mean absolute percentage error, on the container the final configuration ships pointed at.

KOCO's linear modelProphetFFTRNNLSTMTransformer
Mean absolute error75.0 kg48.04 kg (best)60.69 kg92.37 kg61.39 kg150.31 kg
Mean absolute % error40.42%20.8% (best)30.16%36.7%27.68%57.93%
Root mean squared error94.93 kg65.43 kg (best)75.31 kg112.57 kg76.93 kg164.45 kg

Key decisions

Daily instead of hourly

instead of · The finer hourly resolution originally agreed with the client

At hourly resolution about 98% of the series was invented by interpolation, and nothing in the field confirmed that a bin fills linearly within a day. Moving to daily didn't make the model smarter. It made the honest fraction of the data go from 2% to 26%. Choosing the coarser option is what made the numbers trustworthy.

Two evaluations, not one

instead of · A single train/test score, which is what any standard loop gives you

Scoring on all points measures agreement with an interpolation we invented ourselves. A model can look good by being good at reproducing a straight line. Scoring on collection days measures the thing the dispatcher acts on. Running both is what exposed the difference.

Ship the statistical models, drop the deep ones

instead of · Pushing the RNN, LSTM and Transformer harder with more capacity and a real hyperparameter search

They cost the same to train and run and delivered less. With a few hundred daily points per container there is nothing for a large network to find, and the structure that does exist, an annual cycle and a weekly cadence, is exactly what an additive decomposition and a Fourier transform are built for.

Deliver the ability to retrain, not a model

instead of · Handing over the notebooks, which is what the first year produced

A model that only its author can retrain is a consultancy dependency, not a deliverable. Config-driven training and inference as separate services means they can retrain monthly without us.

KOCO Solutions sells software for waste collection, and their existing forecast was an adaptive linear regression: average the fill rate between two collections and extrapolate. It works, but it only ever sees data from collection days, which is a handful of points a week.

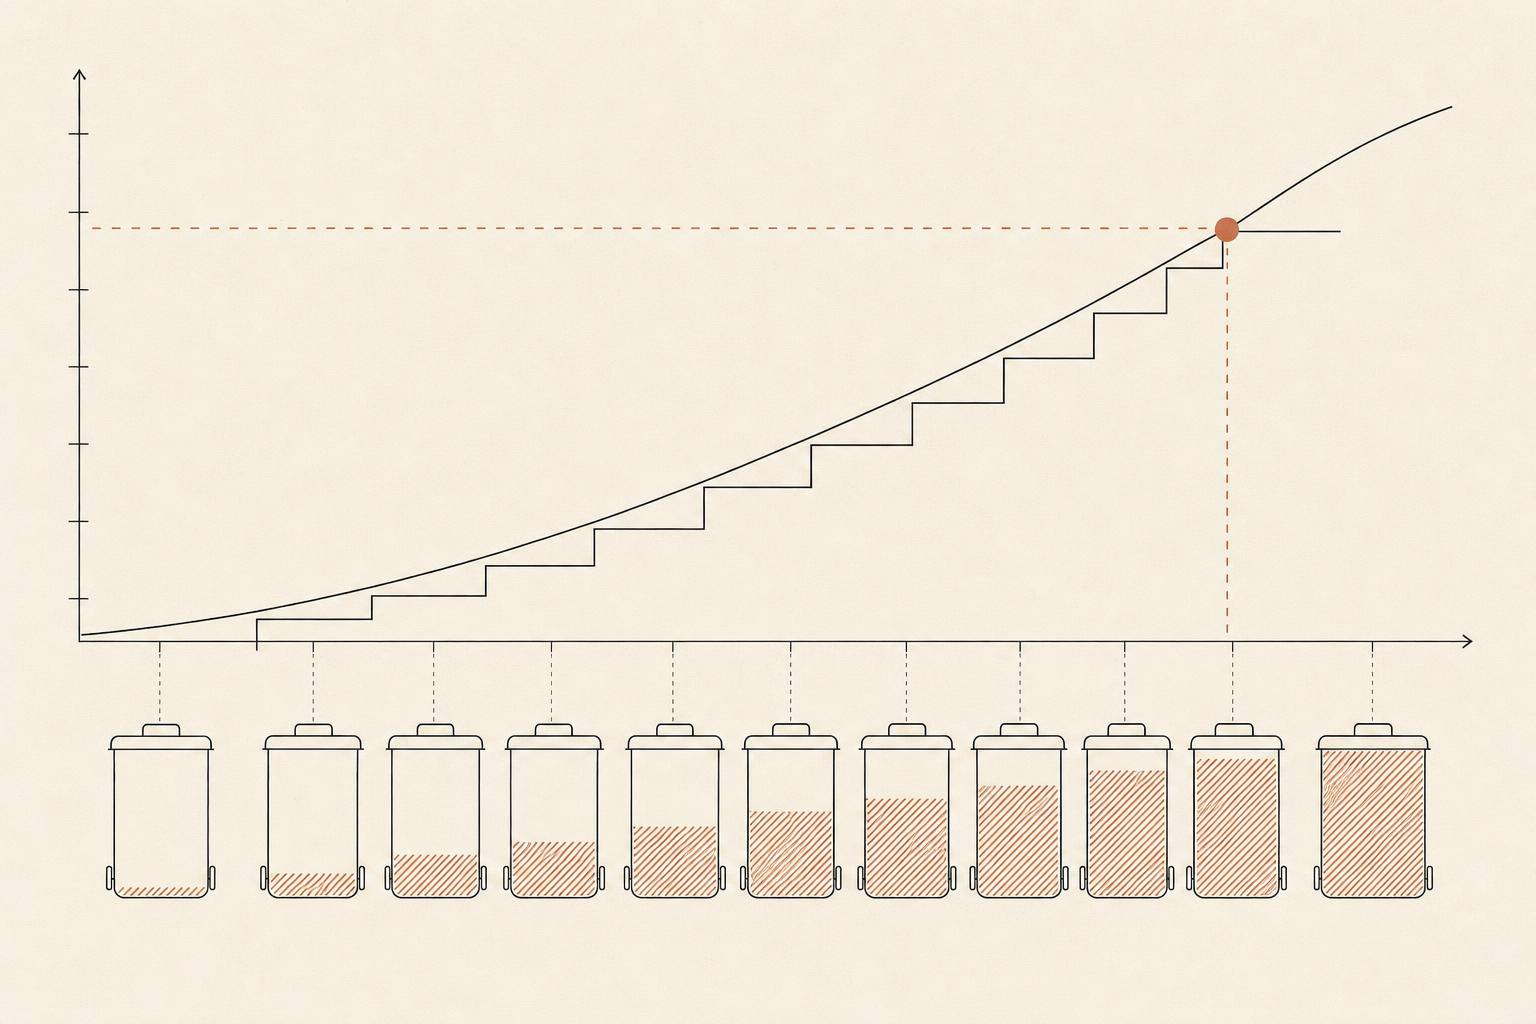
The first problem wasn't modelling, it was shape. Weights recorded at collection points had to become a continuous series before any time-series model could touch them, so we converted the measurements into a chain of linear regressions and interpolated between them to get a fill rate in kg/day. We started at kg/hour, and abandoned it: only 2.15% of those points were real measurements against 25.6% at daily resolution, and there was no field evidence that filling is linear within a day. Choosing the coarser resolution was the decision that made the numbers trustworthy.

Then we put five model families against the incumbent: Prophet, FFT, RNN, LSTM and Transformers. Every model faced the same two-way protocol: one score on every interpolated point, one on real collection days only. The first measures whether the curve is right, the second whether it is useful on the day a dispatcher makes a decision.

The deep models lost. RNNs, LSTMs and Transformers landed at or slightly below KOCO's linear baseline while costing the same to train and run. Prophet and FFT won, and Prophet won clearly: 48.04 kg mean absolute error against the incumbent's 75.0 kg, and 19.80% MAPE against 40.42%. The remaining recommendations came out of exploratory analysis, not taste: outliers were doing real damage, so a log transform and splitting containers by size went in.

It shipped as something they can run without us: a dockerised train-and-infer pipeline configured by TOML, plus a modular analysis toolkit for seasonality, measurement intervals and trends per waste type. We also answered the operational questions a rollout decision hangs on. Roughly four months of history at one to three measurements a week is enough to train, and for a new container at an existing site, a model from a same-type neighbour lands within ±5%.

Both partners rated the project 1 of 4, very successful, in the final report to Innosuisse.
What I learned

  • The most useful thing I did was reduce the resolution. Finer felt better until I measured how much of the finer series was real: about 2%.
  • Once there were two evaluations, the rankings stopped agreeing, and that disagreement was the actual result. A model that tracks a straight line well is not a model that tells a dispatcher whether to send a truck.
  • I tuned recurrent networks and a Transformer twice, at two resolutions, and they lost to a Fourier transform and an additive decomposition. Reaching for the biggest model is a habit, not a method.
  • The client's own feedback taught me the thing I'd underweighted: their linear model starts working from fewer than five measurements, and mine needs about four months of history. On a fleet where many containers are barely measured, that is not a detail. It's the deciding constraint.

What it doesn't do

  • It was research, not production: the models were never deployed on KOCO's fleet.
  • The headline comparison is an aggregate. Per container the picture is less flattering: on the container that ended up in the shipped configuration, the incumbent linear model still edges out Prophet on held-out collection days.
  • The whole approach needs roughly four months of history at one to three measurements a week, which the incumbent does not.